Relating memory performance data to application domain data using an integration API

|
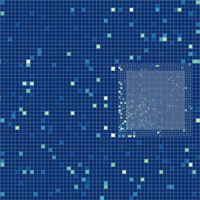
Understanding performance data, and more specifically memory access pattern is essential in optimizing scientific applications. Among the various factors affecting performance, such as the hardware architecture, the algorithms, or the system software stack, performance is also often related to the applications' physics. While there exists a number of techniques to collect relevant performance metrics, such as number of cache misses, traditional tools almost exclusively present this data relative to the code or as abstract tuples. This can obscure the data dependent nature of performance bottlenecks and make root-cause analysis difficult. Here we take advantage of the fact that a large class of applications are defined over some domain discretized by a mesh. By projecting the performance data directly onto these meshes, we enable developers to explore the performance data in the context of their application resulting in more intuitive visualizations. We introduce a lightweight, general interface to couple a performance visualization tool, MemAxes, to an external visualization tool, VisIt. This allows us to harness the advanced analytic capabilities of MemAxes to drive the exploration while exploiting the capabilities of VisIt to visualize both application and performance data in the application domain. |
[DOI/EE link]
@inproceedings{HGLGB15,
  address   = {Austin, TX},
  author    = {Benafsh Husain and Alfredo Gim{\'e}nez and Joshua A. Levine and Todd Gamblin and Peer-Timo Bremer},
  booktitle = {Proceedings of the 2nd Workshop on Visual Performance Analysis},
  day       = {15},
  ee        = {http://dx.doi.org/10.1145/2835238.2835243},
  month     = {11},
  pages     = {5:1--5:8},
  publisher = {ACM},
  title     = {Relating memory performance data to application domain data using an integration API},
  year      = {2015}
}