Visualizing Network Traffic to Understand the Performance of Massively Parallel Simulations
|
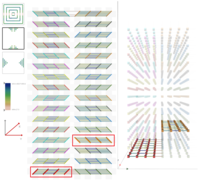
The performance of massively parallel applications is often heavily impacted by the cost of communication among compute nodes. However, determining how to best use the network is a formidable task, made challenging by the ever increasing size and complexity of modern supercomputers. This paper applies visualization techniques to aid parallel application developers in understanding the network activity by enabling a detailed exploration of the flow of packets through the hardware interconnect. In order to visualize this large and complex data, we employ two linked views of the hardware network. The first is a 2D view, that represents the network structure as one of several simplified planar projections. This view is designed to allow a user to easily identify trends and patterns in the network traffic. The second is a 3D view that augments the 2D view by preserving the physical network topology and providing a context that is familiar to the application developers. Using the massively parallel multi-physics code pF3D as a case study, we demonstrate that our tool provides valuable insight that we use to explain and optimize pF3D's performance on an IBM Blue Gene/P system. |
[DOI/EE link]
@article{LLIBGSLBP12,
  author  = {Aaditya G. Landge and Joshua A. Levine and Katherine E. Isaacs and Abhinav Bhatele and Todd Gamblin and Martin Schulz and Steve H. Langer and Peer-Timo Bremer and Valerio Pascucci},
  day     = {16},
  ee      = {http://dx.doi.org/10.1109/TVCG.2012.286},
  journal = {{IEEE} Trans. on Visualization and Computer Graphics (Special Issue {IEEE} {VIS} 2012: InfoVis)},
  month   = {12},
  number  = {12},
  pages   = {2467--2476},
  title   = {Visualizing Network Traffic to Understand the Performance of
Massively Parallel Simulations},
  volume  = {18},
  year    = {2012}
}