Assignment 06
TFs
- Preliminaries
- Submission
- Understanding Transfer Functions
- Running the Volume Renderer
- Designing Your Own Transfer Function Widget
- Implementation Details
- Additional Concerns
- Grading
Preliminaries
The need to visualize 3D volumes is a ubiquitous problem is medicine, engineering, and the computational sciences. These volumes are often complex and contain a wide range of scalar values that represent things like different tissue types, pressure fields, and temperatures. In this assignment you’ll gain experience with one of the most challenging aspects of volume render: transfer function design.
As in the last assignment, we will be using both openFrameworks and VTK. For those who are working with the virtual machine that I’ve provided, I have tested the source code I share below. On the VM, you may need to upgrade the current installed packages using the command pacman -Syu (which will upgrade VTK).
Submission
For this assignment you will submit one directory that demonstrates the various parts of your assignment, named A06P01 I will expect the following structure, in particular with a CMakeLists.txt that conforms to the ofnode/of examples I provide below:
A06P01/
  src/*
  bin/   <-- Do not include data/* in your git repo; the files are large
  CMakeLists.txt
  report.YYY
Understanding Transfer Functions
To begin this assignment, you will explore the volume rendering capabilities of ParaView. ParaView should load the VTK format .vti files that I provided in the last assignment. To enable the volume renderer, switch the representation to Volume and enable the Color Map Editor.
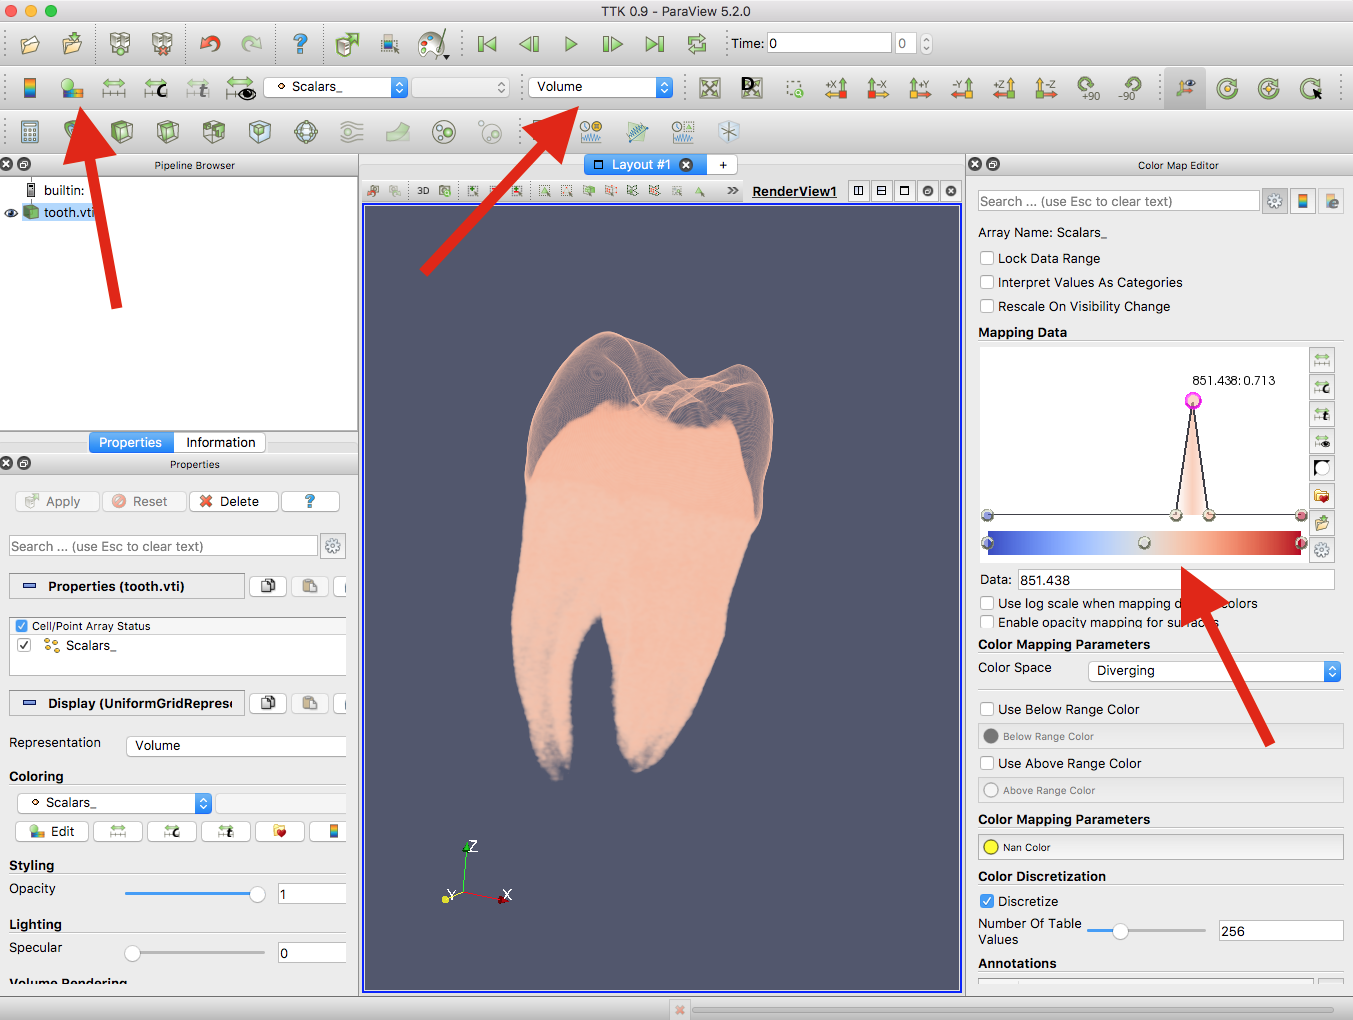
As I’ve demonstrated in class, the color map editor allows you to independently specify a color and an opacity value for each possible scalar value in the domain (minimum value on the left, maximum value on the right). Try and make a decent image; notice that this is not easy to do! Pay attention to the critical alpha channel, as this allows you to effectively hide different portions of the volume. You may it advantageous to create a separate view of the data that shows additional information (e.g. a histogram as in Assignment 02).
In your report, state the datasets you chose to explore and include several images of different stages of your exploration. What did you like about the transfer function editor? What is difficult about this editor / widget? How would you improve the 1D transfer function editor? For additional food for thought, you might want to google other alternatives for possible volume rendering tools. In particular, ImageVis3D has several tutorial videos and sample datasets you can experiment it (unfortunately, ImageVis3D does not support loading .vti files).
Running the Volume Renderer
A challenging concept for volume rendering is transfer function design. Our goal in this assignment is to use openFrameworks to interface with VTK’s vtkSmartVolumeMapper class. I’ve provided a sample OF project that implements a skeleton of this task, described below. Upon execution, you should see two windows appear.
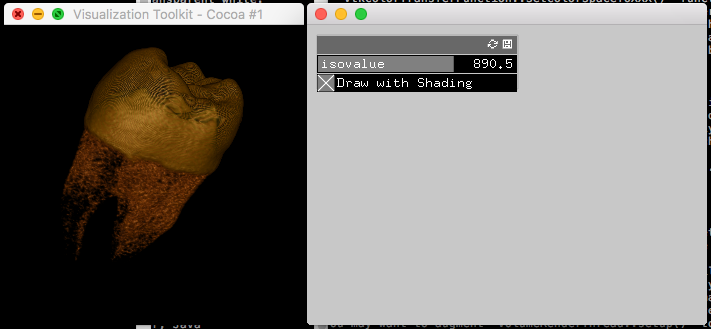
In the volume rendering window, you can move the dataset around using the left and right mouse keys + dragging. This style of panning and zooming interaction is nearly universal for volume visualization tools.
As you run the program, explore the current GUI for the control panel. This provides a simple ramp function to visualize a single isosurface as opaque and make all other parts of the volume transparent. You can also enable/disable shading and lighting, although I’ve only used the default lighting for the VTK scene. Chooe one of the datasets provides and tweak these parameters. In your report, describe what were you able to find from your volume data set? What is useful about the step function? What makes this particular function limited?
Designing Your Own Transfer Function Widget
The main purpose of this assignment is for you to design your own 1D transfer function widget. But first, you should take a step away from the code and go back to pencil and paper. Think about different ways to represent and encode a 1D transfer function. What controls will the user have access to? What user interactions will exist to make it a useful widget? Try out multiple ideas, sketch two possible widgets that are significantly different. Include sketches and discussion in your report and explain how the interactivity works in each.
Note that most transfer function widgets give the users some context about the distribution of scalar values in the volume, i.e. they often show histograms of the scalar values. These histograms can help a user to select appropriate colors and alpha values by targeting the most (or sometimes least) prevalent values. You may want to consider “scenting” your transfer function widget.
Pick one to implement. You will be creating your widget so that it shows up on in the ofApp display. Below we describe in detail where this code goes and what aspects of the existing data structures your widget must modify. The end result of your code will be to take the user input from your widget and use it to adjust the data structures that specify the transfer function values (for both color and alpha).
After implementing your widget, explore some of the provided datasets and describe your finding in your report. See if you can find anything interesting or unique within your data sets. In your report, include screenshots of your widget and the volume for each of the two data sets as well as discussion. Did you find anything interesting in the data sets? What are the strengths and weaknesses of your design? What would you change to make your widget more effective? What are the pros, cons, and challenges for volume rendering as a technique?
Implementation Details
First, download the skeleton code (testVR.zip). This code comes with the tooth.vti dataset, but you will also want to have the datasets from Assignment 05 handy: data05.zip.
This ofnode/of project makes use of ofxGui for the simple transfer function editor, but you are not required to use ofxGui in your final submission. The ofApp is designed with a couple of special features, in particular, it talks to an instance of volumeRenderThread called vr. vr is configured both in ofApp::setup() and it is initially loaded the first time ofApp::draw() is called. Note also the two callbacks for the GUI that update vr, called ofApp::updateIsovalue() and ofApp::toggleShading. Provided that vr has been configured, these directly edit the transfer functions and volume properties. Most importantly, after editing these parameters, they call vr.update() to make sure the VTK window updates.
Next, look at the volumeRenderThread class. This calls uses openFrameworks’ threading capability to simultaneously start a VTK render window. I’ve separated the creation of this thread into two stages: volumeRenderThread::setup(), which loads the dataset and queries its dimensions and range, and volumeRenderThread::setupRenderer() which does the work for instantiating the render window. One executed, the thread will call volumeRenderThread::threadedFunction().
VTK’s volume renderer has a few quirks. Some of the documentation of this is hard to look up, so I recommend reading the documentation for:
You shouldn’t need to get into the details of how the VTK render window and render window interactor work. Most of what I’ve specified here draws from the VTK example SmartVolumeMapper. The VTK examples from their source distribution also include a volume rendering demo GPURenderDemo that supports .vti files. VTK’s wiki also has a collection of tutorials: VTK/Tutorials, and everything under “Basics” might be helpful if you want to learn more.
The most important part of how this all works is editing the parameters for the transfer function, which are specified as a collection of points that are interpolated. In ofApp::updateIsovalue(), you’ll see lines such as:
vr.compositeOpacity->AddPoint(isovalue,1.0);
vr.color->AddRGBPoint(vr.range[0]+0.5*(vr.range[1]-vr.range[0]),1.0,0.0,0.0);
vtkPiecewiseFunction::AddPoint() takes two parameters, the first is the position of the point (in the scalar data range) and the second will be a number between 0 and 1, specifying the alpha value that should be assigned to that scalar value. vtkColorTransferFunction::AddRGBPoint() takes four parameters, the first is the position of the point (again, in scalar data range) and the next three will be red, green, and blue values for the color you want to assign, as floats between 0 and 1.
You are welcome (an encouraged) to edit the volumeRenderThread class definition and provide a better encapsulation for editing the transfer function. One thing you might consider is passing a table of positions and opacity/color values and then using a loop to set all the points. Note that for both functions, you’ll want to clear the points before adding new ones, using ::RemoveAllPoints(). You may also want to experiment with adding lights to the VTK scene, adding other features (like a bounding box), and manipulating the color space using vtkColorTransferFunction::SetColorSpaceToXXX() functions. There are more sophisticated ways to adjust the transfer functions other than using AddXXXPoint(), and you may want to consider experimenting with those. The vtkVolumeProperty class also has some parameters (like shading) that you can control. This is why I’ve kept the volumeRenderThread as a fully public class, to allow you direct access in your ofApp.
Also feel free to adjust the default window sizes. volumeRenderThread::setupRenderer() specifies both the size of the VTK window as well as the background color. The interaction is setup to a default “Trackball” style of interaction, which includes standard mouse functions. There is also a “Joystick” form, that can be toggled by pressing the ‘j’ or ‘t’ keys while the VTK window is in context. Full documentation of the keyboard/mouse interactions can be found here: vtkInteractorStyle.
As a final note, while I have tested this code both on OSX and on the Arch Linux virtual machine, your mileage might vary in getting it to work. I recommend testing this example ASAP. You’ll note that volumeRenderThread has a few #ifndef __APPLE__ calls. In particular, on OSX I was only able to get the GPU-based volume renderer to work, but on the the virtual machine I was forced to use the RayCast renderer (which is a bit slower). You can control which mode using vtkSmartVolumeMapper::SetRequestedRenderModeToXXX().
Additional Concerns
If you are scenting your transfer function widget with a histogram of the scalar field values, then be aware that some of the data sets will be dominated by a single value—this is quite common in volumes. These dominate values are most often uninteresting, such as the background or noise. You are free to ``process’’ your histogram or display it in such a way that will minimize these dominate values. Please make sure to explain what you did in your report. Also note that this will require you directly accessing the vtkImageData member that the volumeRenderThread loads, there is no included interface to process the data. You may want to augment volumeRenderThread::setup() to take advantage of an ImageReader classes that you created for Assignment 05.
Grading
My expectation is that you will submit one new folder in your git repository. This folder should contain everything necessary to compile and run your program as described above. This folder should also contain a report document in a format of your choosing.
A correct implementation of the transfer function editor is worth half of the points. A satisfactory report is worth the other half.
This percentage will be scaled to the total value of this assignment for your final grade (8%). For each of the coding parts, I will specifically check that you’ve read in the data correctly and processed it as described above. I will also check for coding style, commenting, and organization where appropriate.
Extra credit will be awarded for implementing features that significantly go beyond the requirements.