Assignment 01
OFVis
Due: Jan. 30, 2017 11:59:59 PM
Graded: Feb. 06, 2017
Percentage of Grade: 7%
Assignment Description: Finalized
Instructor’s note: this assignment is largely modeled off of an exercise by Jer Thorp using processing, you will find referring to it useful during the assignment.
Your first dataset
From the submissions for assignment 00, I’ve compiled a list of numbers submitted by the class. We’re going to use to visualization to try to understand the distribution of numbers submitted by everyone.
Please download the file here: data01.txt. You will need to place this file in your bin/data directory within your project. Note that I slightly changed this data – I replaced all occurrences of 100 with 99. This ensures all integers were between 0 and 99. There should be 230 total numbers, one per line.
Part 1: A first visualization
Create a new project named A01P01. Place the project directory in your top level folder and git add everything (including bin\data). Do not add any binaries that you compile (e.g. bin\A01P01Debug).
Update the main.cpp to create a window with width 800 and height 800.
In ofApp::setup(), first set the background of the window to black. Next,
declare a data member to your ofApp class to store the numbers you will
read from a file (in ofApp.h). I used a std::vector<int>. Use a file reader of your
choice to populate this dataset in your main (you can use standard c++
filestreams here or try out the OF versions). The function
ofToDataPath() is useful to set the path relative to bin/data.
What we will first do is draw each number as a semi-transparent circle.
You’ll use a piece of code in
your ofApp::draw() function that looks something like this (assuming
class_data is the vector containing each number you read from the data file):
ofSetColor(255,255,255,40);
for (int i = 0; i < class_data.size(); i++) {
  ofDrawEllipse(class_data[i] * 8, ofGetHeight()/2, 8, 8);
};
This loop, while fairly simple, has a tiny bit of sophistication in the color encoding. Each number is drawn as a semi-transparent circle in a position specified by it’s value. Duplicates are draw on top of each other, creating more opacity for more frequent numbers.
After getting to this point, you should see something like this:
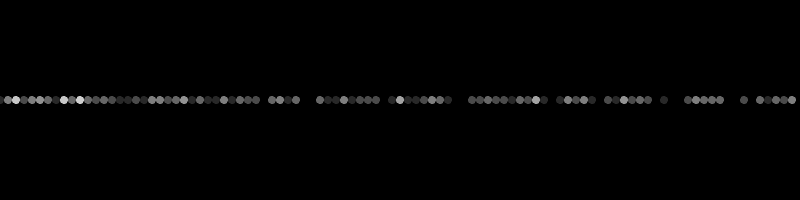
This particular visualization highlights both certain bright values as
well as low values. It’s interesting to ask how random the class was.
To compare, create a second vector of numbers, random_data, and
initialize it in setup(). Note the use of ofRandom():
//setup random numbers
for (int i = 0; i < class_data.size(); i++) {
  random_data.push_back(ofRandom(0,100));
}
Next, modify your code in draw():
ofSetColor(255,255,255,40);
//Class's numbers
for (int i = 0; i < class_data.size(); i++) {
  ofDrawEllipse(class_data[i] * 8, ofGetHeight()/2, 8, 8);
};
//A line of random numbers
for (int i = 0; i < random_data.size(); i++) {
  ofDrawEllipse(random_data[i] * 8, ofGetHeight()/2+10, 8, 8);
};
Modify the above code to draw the class’s data as well as three randomly generated rows of data spaced below it to compare against.
Part 2: Bar Graphs
Make sure you commit and push the files from part 1 before continuing
(excluding binaries). Create a new project named A01P02. Place the project directory in your top level folder and git add everything (including bin\data).
In this part of the assignment, we’re going to make a simple histogram of the occurrence of each number. To do so, we’ll first count how frequent each is, store the counts in an array, and then create a histogram by drawing a bar for each number.
Add two functions to your class: void ofApp::doCounts(vector<int>& data) and
void ofApp::drawBarGraph(int y) as well as variable int data_counts[100] to store
an integer count for each of the possible numbers.
doCounts() should take as input a data array (such as the one you’ve read in and
populated as data_counts) with the number of times each value occurs in the given input vector. Be sure to initialize all elements to zero before counting.
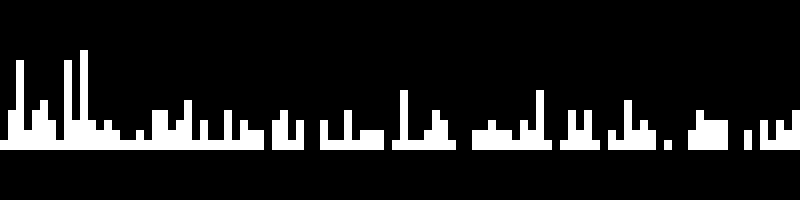
drawBarGraph() should draw 100 bars of width 8 whose heights are scaled by a factor of 10 according to the number of occurrences of each number.
Call doCounts(class_data) from setup(). Call drawBarGraph(y) from draw(), setting the y value to be half of the screen height. Your result will look like this:
Experiment using different colors to encode the bars as well by varying
the fill color of the bars. openFrameworks supports both RGB and HSB
models, but requires you to use ofColor::fromHSB()
(see descriptions from http://openframeworks.cc/documentation/types/ofColor/).
Pick a color scheme of your choice (Jer Thorp’s article suggests a few)
and modify drawBarGraph() accordingly.
Finally, modify doCounts() to return and drawBarGraph() to accept
the counts so that you can reuse these components to draw random bar
graphs to compare against the class data. Space these out using the
y parameter so that the four bar graphs can be compared on screen.
Part 3: Number grid
Make sure you commit and push the files from part 2 before continuing
(excluding binaries). Create a new project named A01P03. Place the project directory in your top level folder and git add everything (including bin\data).
Complete the third portion of Jer Thorp’s tutorial for displaying a grid of
numbers. Keep your color scheme from Part 2 and use ofTrueTypeFont with
verdana.ttf (see bin/data from examples/graphics/fontsExamples) to
create the “bingo” style display.
In addition to submitting your source code for this portion, in A01P03 also
include a text file report.txt. In this report, answer the following
questions:
-
What findings did you determine from the submitted class data? What numbers are most/least frequent? Are there any patterns associated with the digits?
-
Which visualization did you find most effective for seeing patterns? Why?
-
Were the dot plots or bar graphs more effective for comparing the class’s data to random data? Why?
-
How might you improve these visualizations given additional time?
Keep your answers short and concise.
Grading
My expectation is that you will submit three new folders in your git
repository. Each folder should contain everything necessary to compile
and run your program (e.g. all source code and data). A01P03 should
also contain the report file.
Because of the nature of this assignment, there is little room for partial credit. Nevertheless, I expect the following distribution of points:
- 25% Completing part 1
- 25% Completing part 2
- 30% Completing part 3
- 20% Completing the report from part 3
This percentage will be scaled to the total value of this assignment for your final grade (7%). For each of the coding parts, I will specifically check that you’ve read in the data correctly and processed it as described above. I will also check for coding style, commenting, and organization where appropriate.