Design Critiques
Due: Rolling
Graded: Rolling
Percentage of Grade: 5%
Assignment Description: Finalized
Assignment Description
The goal of this assignment is to apply your knowledge of visualization fundamentals to data visualizations that you find “in the field.” Each week three or four students will perform a design critique, which we will discuss online via Piazza. I will post the schedule for this on the class Piazza.
Basic Requirements
For your critique, find an interesting visualization from one of the following (example) types of sources:
- Science magazine (Nature, Science, Scientific American, …)
- Magazine (Time, Popular Science, Popular Mechanics, …)
- Newspaper (NY Times, USA Today, The Economists, …)
- Textbooks
You are not allowed to use sources where the focus is on visualization (e.g. IEEEVis papers, TVCG entries, and other venues where the topic is primarily vis). For your critique, go to original publication used by practitioners and researchers. Be creative, search for data that is being visualized in potentially unexpected ways—it’s all around us.
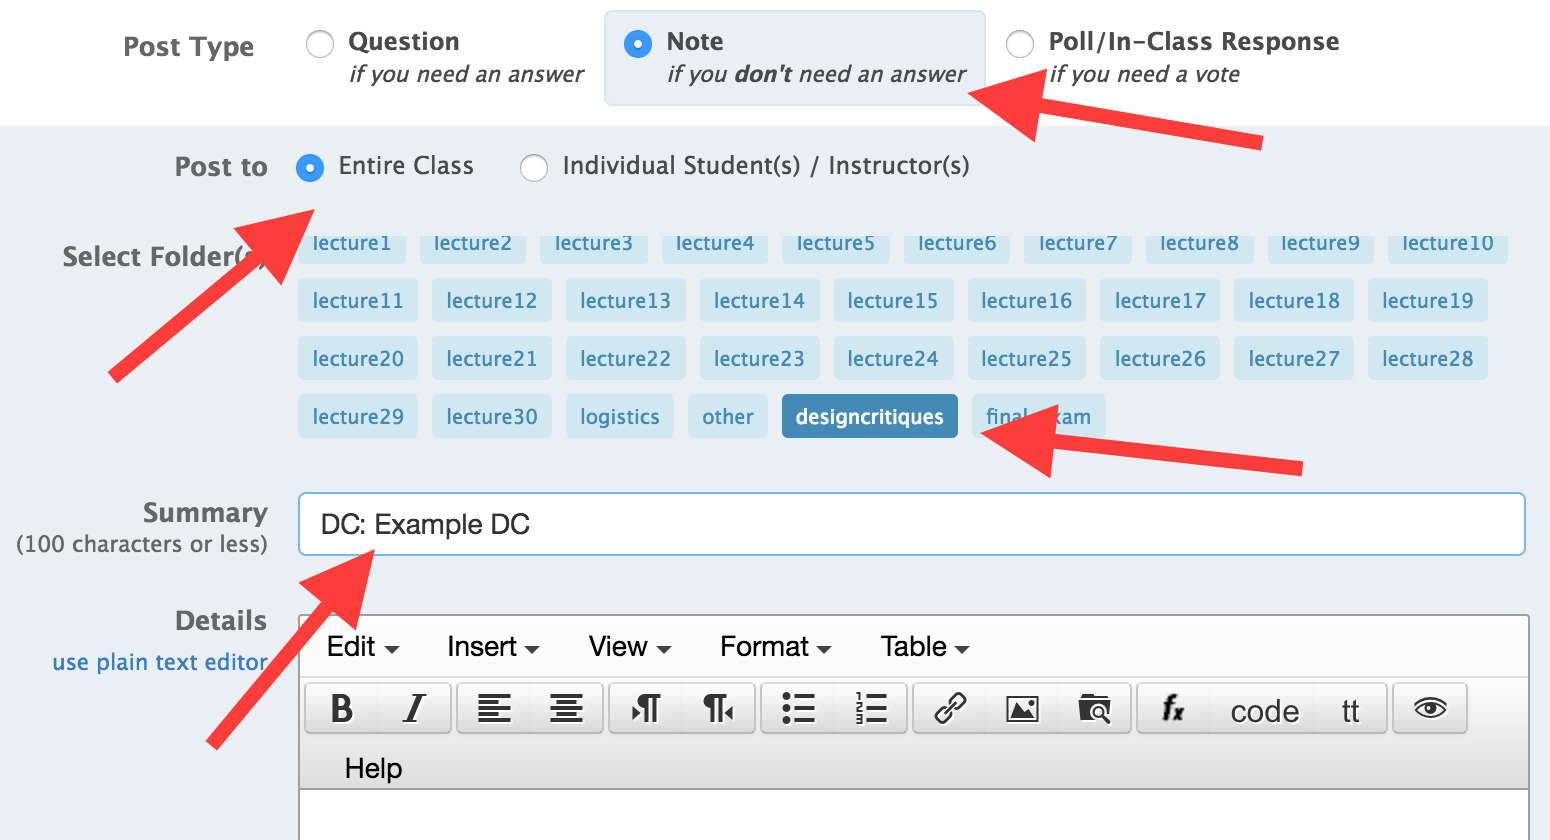
Once you have selected your visualization explain the data being shown (later in the semester this will mean data type and semantics) and the visual encodings used—put into words what the visualization is trying to show. Try to apply the set of types, models, and categories discussed in class. Next, critique the visualization: what works and what doesn’t? How do you feel the visual encoding lends to communicating the data? Is the visualization clear or is it misleading? Do you like it (or not), and why? What could be improved? Compose your explanation and critique in at most 3-4 paragraphs and create a new, public note for it on Piazza. Tag it with the designcritiques folder. Make sure this note provides a link to the original visualization (if possible) or at least include an image in the post.
Format your note’s subject like this:
DC: [insert title of the visualization you're critiquing]This should look like:

Finally, if you are not authoring a critique, each week you are required to actively participate in one of the new threads for that week. Your comments should be thoughtful; a single sentence saying “I like it” is not enough! Do you agree with the critique? If so, why (or, why not)? Did the critique miss anything? Did you learn something new? Please be constructive, not critical. Your peers will be discussing your critique as well!
Be sure to follow:
Submission and Grading
Critiques are due by Tuesday at 11:59pm of the assigned week.
Your grade will be based on how well you describe and critique the visualization you post based on the language and concepts we have covered in class. Additionally, we will check that each class member has commented on a new thread before 11:59pm each Thursday. If you posted a critique for the week you do not need to comment on another critique. However, you should participate in the discussion on your thread; don’t leave a good discussion hanging, especially if there are questions!
Your discussion activity each week will also be counted towards part of the class participation component of your final grade.
Cumulative Relationship to Final Grade
Completing a design critique is 5% of your final grade, while participating in the discussions associated with other design critiques will contribute to your class participation grade.