Assignment 05
Transfer Functions
Due: Nov. 15, 2023 03:29:59 PM
Graded: Nov. 22, 2023
Percentage of Grade: 9%
Assignment Description: Finalized
- Objectives
- Description
- Designing Your Own Transfer Function Widget
- Written Questions (worth 25/90 points)
- Submission
- Grading
- Extra Credit
In this assignment, you will write code to visualize three-dimensional scalar fields through the use of volume rendering. We will rely on a volume renderer from the VTK library.
Please click here to create your repository
Objectives
This assignment is designed to teach more advanced scalar field visualization through understanding how transfer functions work, utilizing a mapping from data values to optical properties. Specific objectives include:
- Utilizing transfer functions to specify the input to a volume renderer.
- Implementing an interface to specify transfer functions using d3.js.
- Understanding how interacting with a transfer function can be used to investigate volumetric data
- Experimenting with your designed transfer functions to investigate three-dimensional scalar fields.
Description
In this assignment, we will be utilizing volumetric scalar fields. Your template repo includes four example scalar fields in the datasets directory. These are encoded as a .vti (VTK ImageData) format, which will be parsed for you using the vtk.js library. This library will also do the heavy lifting of computing the volume rendered image. Your main task is to build an interface in d3.js to design the transfer functions that vtk.js will adjust how the final image looks.
To begin this assignment, I recommend you explore the volume rendering capabilities of ParaView. After downloading, ParaView should load the VTK format .vti files that I provided in the last assignment. To enable the volume renderer, switch the representation to Volume and enable the Color Map Editor.
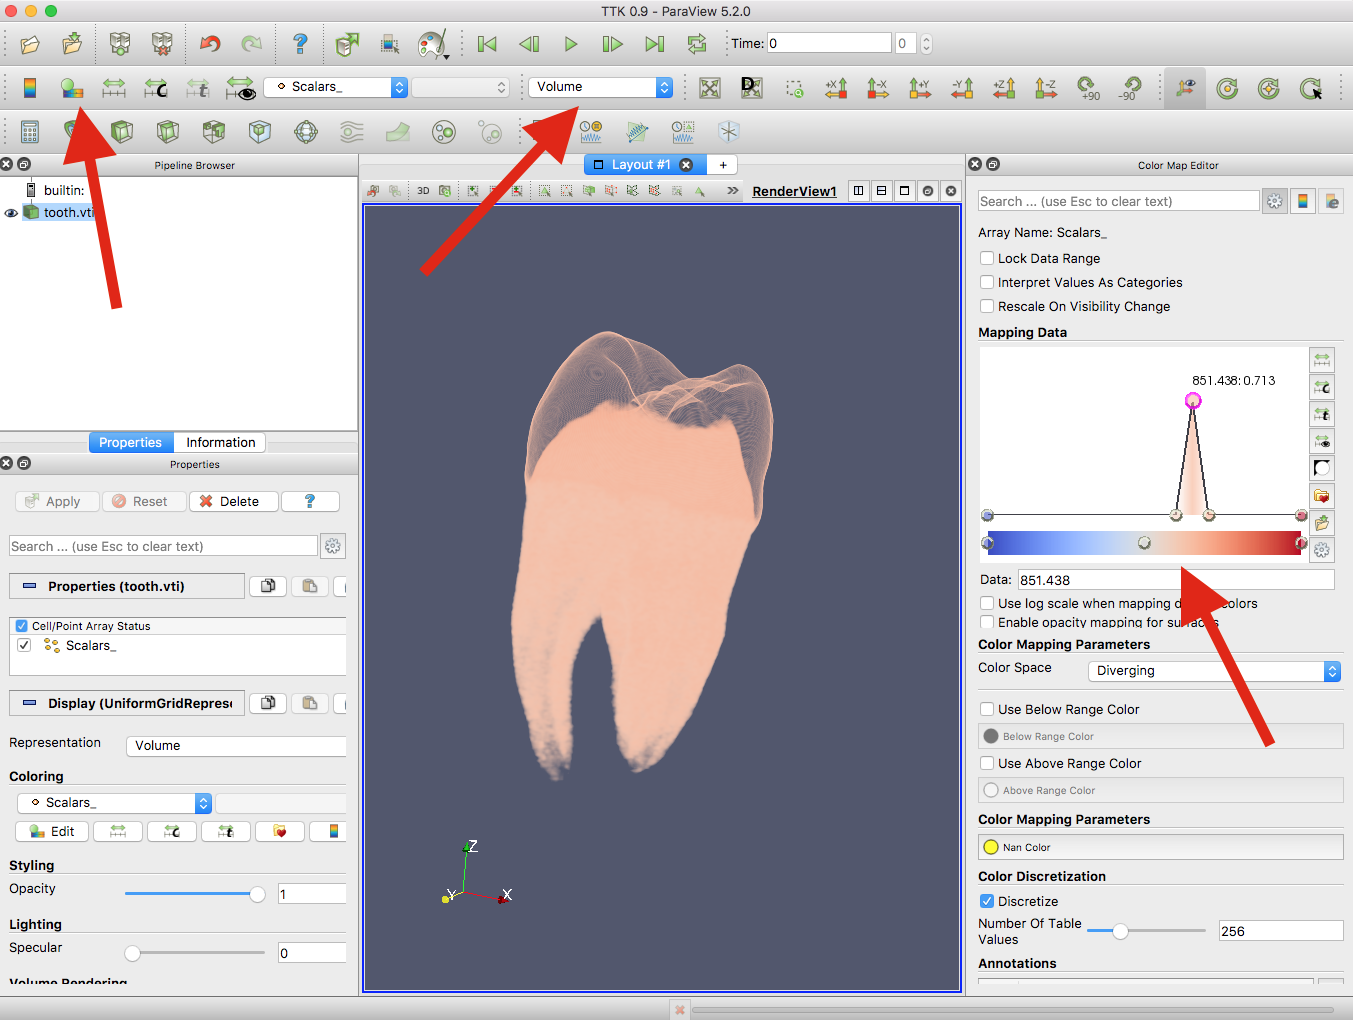
As I’ve demonstrated in class, the color map editor allows you to independently specify a color and an opacity value for each possible scalar value in the domain (minimum value on the left, maximum value on the right). Try and make a decent image; notice that this is not easy to do! Pay attention to the critical alpha channel, as this allows you to effectively hide different portions of the volume.
Preliminaries
We have provided a skeleton code for you in volren.js as well as a05.js. volren.js should not need to be edited. It includes two functions initializeVR() and updateVR() that will be create a volume rendering canvas as well as update it with modified transfer functions.
The template html file, index.html, is set up so that it has two different div’s, one for the volume renderer, with id volren, and one for the transfer function editor, with id tfunc. tfunc will ultimately contain an SVG element that you specify using d3.js.
Your transfer function editor should be designed to modify and visualize the contents of two variables: colorTF and opacityTF, both declared in a05.js. To accomplish this, you will use d3.js to populate the contents of an SVG objects stored in the div tfunc.
Both transfer functions will be encoded as a simple list of pairs of the format [t, val] where t is a particular scalar value and val is either an opacity (between \([0,1]\)) or a color (specified as a d3.rgb() object). These pairs are control points that VTK will linearly interpolate for you to define the appropriate color (emission) and opacity (absorption) values for any scalar value.
Besides the canvases, you’ll note an input button in index.html that is connected to javascript function upload() in a05.js. This should handle all of the loading of any .vti files, as well as calling the appropriate functions to initialize/update the volume renderer and transfer function editor.
Designing Your Own Transfer Function Widget
The main purpose of this assignment is for you to design your own transfer function widget. But first, you should take a step away from the code and brainstorm. Think about different ways to represent and encode a 1D transfer function. What controls will the user have access to? What user interactions will exist to make it a useful widget? To accomplish this, it helps to focus on the constraints needed for each of the two variables:
Part 1: Implementing Color Transfer Functions
To design the color transfer function, the user must be provided with mechanisms that can populate the colorTF variable in different ways. Minimally, your interface must let the user design color maps of three types: a sequential color map, a diverging color map, and a categorical color map of your choice. You may want to consider many of the predefined color maps that d3 constructors for you. See d3-scale-chromatic for many examples here.
Specifying a color transfer function requires two pieces. You must: (1) specify the variable colorScale that will be used to interpolate color for your interface and (2) specify the variable colorTF that will be a list of colors you pass to VTK.
Your specification should cover the full range of data values. When the input dataset is loaded by the function initializeVR, it will populate a global variable dataRange with the minimum (dataRange[0]) and maximum (dataRange[1]) of the dataset. You should use this to specify a list of color values in colorTF.
For the sequential scale, the colorTF you specify must correspond to a sequential color map. I recommend using at least a few control points for this (d3.schemeXXX allows you to design a variety of scales this way, typically using 3 to 9 control points).
Your interface could achieve the minimum requirement by offering pre-defined options for three color maps (sequential, diverging, and categorical). These could be controlled with buttons to load them if you wish. More generally though, your goal is to provide an interface to allow the user to manipulate these by changing the colorScale variable directly. You can then use this scale to specify a list of points for colorTF.
Once a new color transfer function is specified, you should update the visualization of the interface by calling updateTFunc() and update the transfer function with the volume renderer by calling updateVR(). Note that, when using a categorical color map, you should set the optional third parameter of updateVR() to true. When set to false, it forces VTK to linearly interpolate the color map, when set to true, it will use nearest neighbor interpolation, and when undefined, it will keep the current state.
Finally, after implementing these three variants for color maps, you should generate a visualization that shows them in the tfunc view. There are a few ways to do this: you could (like Paraview) draw a simple color bar (using a collection of very thin rectangles) that samples across the dataRange and populating their fill color with colorScale. Another option might be to use curves that allow the user to manipulate color channels relative to data values. Of course, this interface might differ depending on which color space you choose to work with.
Part 2: Implementing Opacity Transfer Functions
Your second design task is to build an interface to adjust the opacity transfer function. Like color transfer functions, your opacity transfer function should be specified by a list of control points, this time stored in the variable opacityTF. This list will be passed to VTK to control the volume rendering process.
While it is not the only way to do it: it might be simplest to think about specifying this as an editable curve (like in the assignment demo I showed in L19). To accomplish this, you can specify a set of points in opacityTF. Each of these will be visualized by drawing a polyline where you can drag the corners of the polyline to update the control points of opacityTF. This will require two scales, xScale and yScale, that will map from data attributes to screen space. Specifically, xScale should map from the range of data values, and yScale should map from the space of possible opacities (\([0,1]\)).
To draw an editable curve, we will draw both a polyline as well as a set of discrete circles. The circles will be hooked to a d3 drag interface, specified by 3 functions for the start, movement, and end of a drag event. The start event will set a variable selected for which control point is selected, which we do using a variable index. The drag event should access the position of the mouse and update opacityTF as the mouse moves. When this happens, you should then update both the visualization of the polyline by calling updateTFunc() and update the volume renderer by calling updateVR(). You might find this example of a line chart with draggable circles particularly helpful. (Note: older versions of d3 had a slightly different signature for drag events, so when you’re looking for examples online keep this in mind. See https://observablehq.com/@d3/d3v6-migration-guide#events for more details.)
Regardless of what interface you implement, your tool should enforce specifying correct transfer functions only. With a curve-based transfer function, this amounts to two criteria: First, if the point being dragged is one of the endpoints of the curve, you should only allow it to move up or down. This will ensure that all possible scalar values have a defined opacity. Second, when moving an interior point to the polyline, you not allow it to move so far left or right so as to cross the point before or after it in the curve. Both of these constraints can be checked by looking at the value pos defined in the function dragged(). All points must only be allowed to be moved within the range of valid control points. All \(x\)-coordinates must lie within dataRange and all \(y\)-coordinates must lie within \([0,1]\).
Written Questions (worth 25/90 points)
-
Explain, using our effectiveness principles, one possible setting (task) where one might prefer to use a choropleth instead of a cartogram. Next, explain one setting where one might prefer a cartogram.
-
Explain the cause of, and a possible fix for, the ambiguous case that exists in the Marching Squares algorithm.
-
This assignment asks you to specify (at least) 3 different possible color transfer functions based on sequential, diverging, and categorical maps. Evaluate the utility of each of these three options (feel free to experiment with your implementation!) Are each of them effective?
Submission
You should use git to submit all source code files. The expectation is that your code will be graded by cloning your repo and then executing it within a modern browser (Chrome, Firefox, etc.)
Please provide a README.md file that provides a text description of how to run your program and any parameters that you used. Also document any idiosyncrasies, behaviors, or bugs of note that you want us to be aware of.
To summarize, my expectation is that your repo will contain:
- A
README.mdfile - A
index.htmlfile - An
a05.jsfile - All other Javascript files necessary to run the code (including
volren.js,vtk.js, andd3.jsplus any others you require) - Any
.cssfiles containing style information
Grading
Deductions
| Reason | Value |
| Bugs or syntax errors | Up to -10 each bug at grader's discretion to fix |
Point Breakdown of Features
| Requirement | Value | ||||||||||||
| External documentation (README.md) following the template provided in the base repository | 5 | ||||||||||||
| Consistent modular coding style, indentation, etc. | 5 | ||||||||||||
| Header documentation and internal documentation (Block for functions and Inline descriptive comments). Wherever applicable / for all files | 5 | ||||||||||||
Expected output / behavior based on the assignment specification, including
| 50 | ||||||||||||
Written Questions
| 25 | ||||||||||||
| Total | 90 | ||||||||||||
Cumulative Relationship to Final Grade
Worth 9% of your final grade
Extra Credit
Implementing features above and beyond the specification may result in additional extra credit, please document these in your README.md.
Particularly, you may want to consider additional user interface features that allow you to inspect and/or edit the transfer function. These interfaces might also provide additional data to the user that help them to design it, e.g. a histogram of data values.
Instead of using manually specified color transfer functions, you are welcome to consider a more sophisticated interface when the user can design a color transfer function. Depending on the sophistication level, this is worth as much as 50% extra credit. If you choose to implement such an interface, you need not support the button-based selection, provided they support designing colorTF’s which are equally or more sophisticated.