Assignment 01
D3 Basics
Due: Sep. 13, 2023 03:29:59 PM
Graded: Sep. 20, 2023
Percentage of Grade: 9%
Assignment Description: Finalized
- Objectives
- Introduction
- Visualization 1: SVG only
- Visualization 2: Javascript + SVG
- Visualization 3: Using d3.js
- Written Questions (worth 25/90 points)
- Submission
- Grading
- Extra Credit
In this assignment, we’ll build up our skills on using HTML, CSS, and SVG elements to display data, and learn how to programmatically build visualizations with these elements with both Javascript and d3.js.
Please click here to create your repository
Objectives
This assignment is designed to onboard you to developing visualizations in d3.js. We’ll be using the web stack as our vehicle for displaying such visualizations, which we will create in three different ways: (1) “by hand”, (2) through Javascript without any libraries, and (3) using d3.js. Specific objectives include:
- Practicing and reviewing HTML, CSS, and SVG syntax
- Analyzing and debugging syntax errors through a developer console (e.g. Chrome’s or Firefox’s)
- Practicing and reviewing Javascript syntax for specifying SVG elements and their attributes
- Experimenting with the basics of enumerable types and higher order functions in Javascript
- Experimenting with the data binding paradigm of d3 through the use of the general update pattern
- Using all of these tools to generate simple visualizations of data by mapping data elements to visual elements
Introduction
You will submit an HTML file named index.html, together with any other files you choose to create and reference within it. When loaded in a browser, this file should display all visualizations you are tasked with creating (described below). Each visualization should be an SVG element of 500 pixels in both width and height. The id of the SVG element containing the first visualization should be plot1, the id of the element containing the second visualizations should be plot2, and so on.
I found it easiest to append these SVG elements to <div> elements that I created with the ids div1, div2, and so on. The skeleton of index.html that I provided for you reflects this choice, but you are welcome to deviate from it and arrange the charts in the HTML file as you see fit (within the parameters I set below).
Provided you satisfy the minimum requirements, feel free to add other visual elements. Some ideas for additional features are suggested in the extra credit section below.
Following the three visualizations, you will also insert the answers to the three written questions in index.html.
Dataset
The dataset we will use contains standardized scores for all Calvin College 2004 seniors that have taken both the ACT and the SAT, together with their GPAs. There are 271 data points and 4 dimensions.
For your convenience, I have processed the original csv file into a Javascript source file included in the starter repo named scores.js. The dataset looks like this:
var scores = [
 { SATM:430, SATV:470, ACT:15, GPA: 2.239 },
 { SATM:560, SATV:350, ACT:16, GPA: 2.488 },
 { SATM:400, SATV:330, ACT:17, GPA: 2.982 },
 { SATM:410, SATV:450, ACT:17, GPA: 2.155 },
// 263 more rows
 { SATM:700, SATV:680, ACT:35, GPA: 3.911 },
 { SATM:720, SATV:770, ACT:35, GPA: 3.981 },
 { SATM:750, SATV:730, ACT:35, GPA: 3.882 },
 { SATM:790, SATV:780, ACT:35, GPA: 3.887 }
];
Visualization 1: SVG only
For your first visualization, you will create a scatterplot of circles, showing SAT’s mathematics scores (SATM column) versus SAT’s verbal scores (SATV column). In other words, the \(x\)-coordinate of the plot should encode the SATM variable, and the \(y\)-coordinate should encode SATV. All circles should have a fixed radius and fixed color (please customize these however you like).
For this visualization, and only for this visualization, you will have three additional constraints: (1) you cannot use any programming language to generate this plot at run time, (2) you only need to plot the first 10 data points from scores.js, and (3) all code for the SVG <circle> elements should be entirely within index.html, with the exception of any styling you might do in a separate CSS file.
Note that we have specified an SVG element that \(500\times500\) pixels, but SAT scores (in theory) can range from 200 to 800. When plotting the data points, you will be required to compute (by hand) an appropriate scale for the values in scores.js so as to fit the data coordinates into spatial coordinates. Take care and be thoughtful with this: how to define this scaling is at the heart of doing visualization.
Visualization 2: Javascript + SVG
As you might imagine, the process for Visualization 1 is enormously limited, both in terms of your ability to present the entire dataset as well as your ability to generalize, refine, edit, or update the plot. While it’s helpful to get comfortable with the syntax of SVG, we can do better by relying on programming elements.
For your second visualization, you will create a different scatterplot. This scatterplot should show the sum of both SAT scores on the \(x\)-axis and the ACT scores on the \(y\)-axis. It should also varying the radius and color of the circles to represent GPA. There should be one SVG <circle> element for every point in the dataset.
You may use any sequence of Javascript calls that you like, but there should be absolutely no HTML/SVG coded in index.html beyond what I’ve provided in the skeleton. You will have to write the code to add the <svg> element to <div> with id div2, you should set its attributes, and then use Javascript to create the <circle> elements for each entry in the scores array.
While you’re not required to, I recommend that you rely on the code described in Scheidegger’s Lecture 04, in particularly using the make() and plotAll() functions that leverage higher order functions for specifying elements and their properties. We have included such functions in Javascript file svg.js. These are particularly helpful in structuring your visualization similar to how d3.js does it. But, if you choose, you can feel free to deviate and not use the functions in svg.js if you prefer.
For colors, note that the function rgb() in svg.js expects values for r, g, and b in the range \([0,1]\). See iteration_8.js for an example of how one might do this mapping, but you are encouraged to experiment.
All code that creates this visualization should be included in a Javascript file called plot2.js. This file should be included using a <script> tag in index.html. We have already included svg.js in index.html for you as an example.
As plot2.js will be the first “code” that you write in this class, good coding conventions apply! Please include a comment at the top of all .javascript files that indicates what it is in the file and who wrote it (see scores.js and svg.js for examples). This code should also include clear documentation and commenting.
Visualization 3: Using d3.js
Finally, your last visualization should recreate Visualization 2 using d3.js. In the starter repo, I have provided d3.js which includes the d3 library. Your visualizations must be created using d3 calls. In other words, the way to turn data into SVG elements has to be through d3 methods like selectAll(), data(), enter(), and append(). Do not use any functions from svg.js.
For this portion of the assignment, you are also allowed to use any additional library you’d like to provide extra functionality. You are required to use d3 for the basic plotting, but maybe you’ll also want to use jQuery, underscore.js, or another helper library to augment the visualization. If you choose to do this, remember to give proper attribution in your README.md and source code.
All code that creates this visualization should be included in a javascript file called plot3.js. This file should be included using a <script> tag in index.html. We have already included d3.js in index.html for you as an example.
Written Questions (worth 25/90 points)
Each written question should be answered with a brief paragraph (approximately 100 words or less) in index.html. I will not read extra material if I deem the answer too long.
-
Describe how you chose to map from the data space to the screen space for positions in Visualization 1. Do not use an equation, but rather describe this mapping in prose. Do you think your visualization makes it clear what this mapping is? If yes, state why. If no, state what you could do to improve it.
-
How helpful do you think the combination of the circle radius with circle color is? It might help to look ahead a bit to L06’s reference on preattentive processing. To experiment, you may want to vary which variables are encoded into which properties.
-
Visualizations 2 and 3 suffer from some amount of overplotting. How would you solve it? (Overplotting is what happens when the second shape your draw goes entirely over the first shape. As a result, you cannot tell if the first point was there to begin with, or, more generally, how many points are “hiding”) It might help to consider ways in which more than one shape can contribute to the final color of each pixel.
Submission
You should use git to submit all source code files. The expectation is that your code will be graded by cloning your repo and then executing it within a modern browser (Chrome, Firefox, etc.)
Please provide a README.md file that provides a text description of how to run your program and any parameters that you used. Also document any idiosyncrasies, behaviors, or bugs of note that you want us to be aware of.
To summarize, my expectation is that your repo will contain:
- A
README.mdfile - A
index.htmlfile - A
plot2.jsfile - A
plot3.jsfile - All other Javascript files necessary to run the code (including
calvinScores.js,svg.js, andd3.jsplus any others you require) - (Optionally) a
.cssfile containing style information
Grading
Deductions
| Reason | Value |
| Bugs or syntax errors | Up to -10 for each bug at grader's discretion |
Point Breakdown of Features
| Requirement | Value | ||||||
| External documentation (README.md) following the template provided in the base repository | 5 | ||||||
| Consistent modular coding style, indentation, etc. | 5 | ||||||
| Header documentation and internal documentation (Block for functions and Inline descriptive comments). Wherever applicable / for all files | 5 | ||||||
Visualization 1
| 10 | ||||||
Visualization 2
| 20 | ||||||
Visualization 3
| 20 | ||||||
Written Questions
| 25 | ||||||
| Total | 90 | ||||||
Cumulative Relationship to Final Grade
Worth 9% of your final grade
Extra Credit
Implementing features above and beyond the specification may result in extra credit, please document these in your README.md. In addition, here are some concrete suggestions to consider:
Axis Annotations
Add axis lines, labels and tick marks to the \(x\) and \(y\) axes of your visualizations. In other words, to get this extra credit, instead of looking like this:
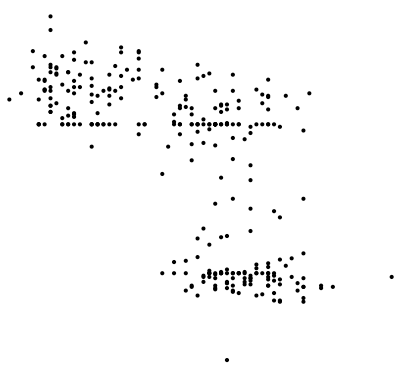
your plots should look like this:
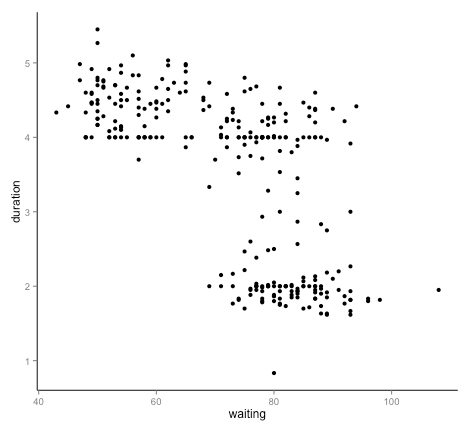
(Of course, the dataset I just used in the example above is not the same as the one you have, so the values for the tick marks, labels, etc. will all be different).
Some things you will need to consider:
- margins for your axes, tick marks, and axis labels
- try to pick good values for the tick marks, and a good number of them: not too many, and not too few.
If you chose to rely on additional libraries, be sure to document these in your README.md. But, the rules of the assignment must still be followed, i.e. Visualization 2 should use only Javascript and Visualization 3 should primarily use d3.js. Note that creating axes by hand, particularly in Visualization 2, likely requires a significant amount of extra code (and thus awarded points of extra credit will reflect this extra effort).