Assignment 12
Flow Visualization
Due: May. 04, 2020 03:29:59 PM
Graded: May. 11, 2020
Percentage of Grade: 5%
Assignment Description: Finalized
- Objectives
- Description
- Part 1: Colormapping Vector Magnitude
- Part 2: Line Plots
- Part 3: Uniformly-Placed Arrow Glyphs
- Part 4: Randomly-Placed Custom Glyphs
- Submission
- Grading
- Extra Credit
In this assignment, you will write code to visualize two-dimensional vector fields through the use of color mapping and glyphs. Each of these visual encodings will be used to show different properties of the vector field in different combinations.
Please click here to create your repository
Objectives
This assignment is designed to teach you the basics of vector field visualization through encoding per-position properties with a variety of techniques. Specific objectives include:
- Using color mapping to visualize vector field magnitudes.
- Utilizing line glyphs to visualize vector field directions.
- Using glyphs that use geometry to encode both magnitude and orientation.
- Developing custom glyphs that use multiple encoding channels to redundantly encode information about the vector field
- Further practice in using SVG shapes.
- Experimenting with various glyphs for encoding vector fields to help to understand the strengths and limitations of each.
Description
We will visualize a new dataset in this assignment that is a simulation of 3 vortices that rotate in different directions. This dataset is encoded much the same as the previous field data we’ve worked with, with a collection of \(50\times50\) cells that each store a 2D vector \((v_x,v_y)\)
{
  "vx": x-component-of-vector,
  "vy": y-component-of-vector,
  "Col": i,
  "Row": j
}
So, like A06, the main selections we are doing will be vertex-focused. Each vertex will be visualized using an area that is \(10\times10\) pixels. We’ve constructed the grid for you with the appropriate transformations so that you can refer to the vertex in a local coordinate space (similar to A10).
You will visualize this data in four different ways.
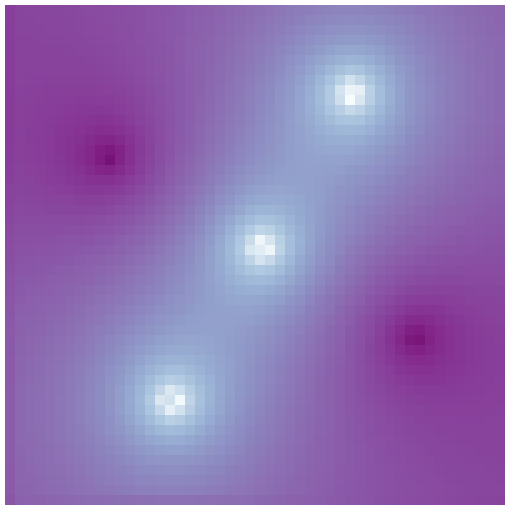
Part 1: Colormapping Vector Magnitude
For part 1, you should implement a color map that shows the magnitude of each vector as a rectangle whose fill color corresponds to magnitude. Recall that the magnitude of a vector can be computed as \(\sqrt{v_x^2 + v_y^2}\). The data provided has magnitudes that range from approximately \([0,2]\). You should select an appropriate color map that shows the corresponding data. The rectangles should be positioned and sized relative to local coordinates. Your solution should look something like this:
Part 2: Line Plots
For part 2, you should draw a line glyph that indicates the direction, but not the orientation, of the flow. This glyph should be centered in the available space (\((5,5)\)) and extend equally in both the forward and reverse direction of the vector field. It’s length should be uniform as well which can be achieved by normalizing the vector (dividing the coordinates by its length). Your solution should look something like this:
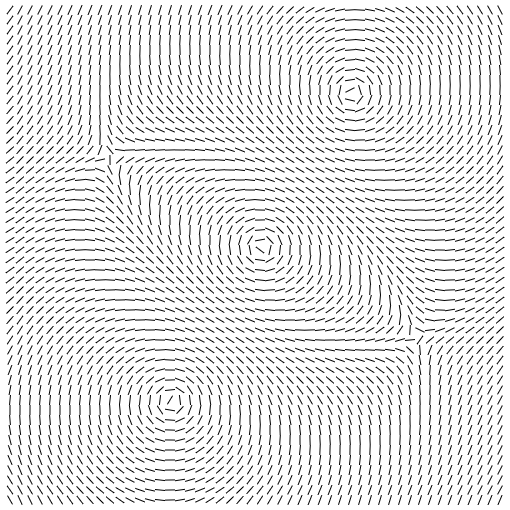
Such plots should reveal only an indication of which way the vector field is flowing, but not its orientation or magnitude.
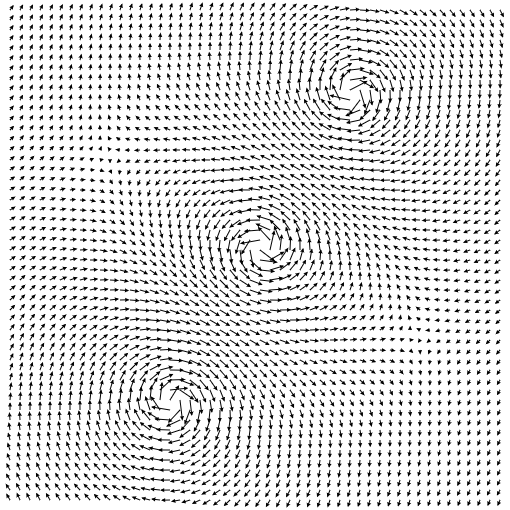
Part 3: Uniformly-Placed Arrow Glyphs
For part 3, you should draw a glyph that is shaped like an arrow. These glyphs will be uniformly placed and use geometry to visualize both the magnitude and direction of the vector field.
Arrows should be placed so their tails are in the center of the space and extend only along the direction the vector field is pointing. They should have some kind of triangular cap indicating this direction. The length of the arrow should correspond to the length of the vector. SVG paths can be used for this. Your solution should look something like this:
A few hints: first, it may help to consider drawing two pieces for each arrow, using a separate SVG path for the stem and head of the arrow. This isn’t necessary, but I found it easier to think about. Second, it’s easier to draw the arrow pointing in one fixed direction, and then rotate the entire arrow using the appropriate SVG commands. You will also likely want to use Math.atan2 to compute the angle of this rotation. Third, SVG transform attributes can have more than one instruction. See the example “Rotating and translating and SVG element” in the MDN documentation.
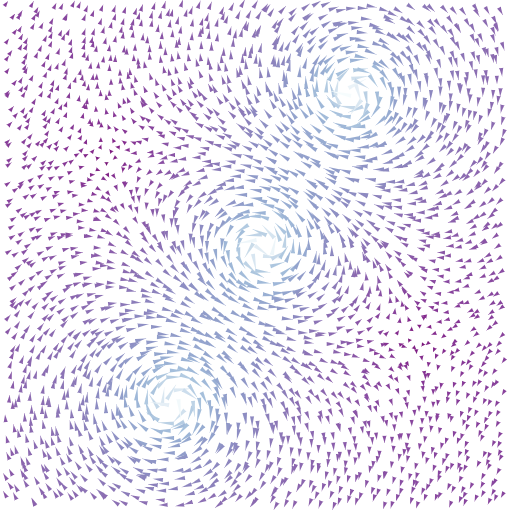
Part 4: Randomly-Placed Custom Glyphs
For part 4, you will correct the visual artifacts caused by uniformly placing glyphs by applying a random jitter to their location.
For this glyph, you should also draw a custom glyph of your choice. This glyph can be any shape you find interesting, but it must encode both the direction and magnitude of the vector field. It should also make use of both geometry and color. My solution (which is one of many possible ones!) looked something like this:
Submission
You should use git to submit all source code files. The expectation is that your code will be graded by cloning your repo and then executing it within a modern browser (Chrome, Firefox, etc.)
Please provide a README.md file that provides a text description of how to run your program and any parameters that you used. Also document any idiosyncrasies, behaviors, or bugs of note that you want us to be aware of.
To summarize, my expectation is that your repo will contain:
- A
README.mdfile - A
index.htmlfile - An
a12.jsfile - All other Javascript files necessary to run the code (including
data.jsandd3.v5.jsplus any others you require) - Any
.cssfiles containing style information
Grading
Deductions
| Reason | Value |
| Bugs or syntax errors | -10 each bug at grader's discretion to fix |
Point Breakdown of Features
| Requirement | Value | ||||||||
| Consistent modular coding style | 5 | ||||||||
| External documentation (README.md) following the template provided in the base repository | 5 | ||||||||
| Header documentation, Internal documentation (Block for functions and Inline descriptive comments). Wherever applicable / for all files | 10 | ||||||||
Expected output / behavior for your chart based on the assignment specification, including
| 80 | ||||||||
| Total | 100/100 | ||||||||
Cumulative Relationship to Final Grade
Worth 5% of your final grade
Extra Credit
Implementing features above and beyond the specification may result in additional extra credit, please document these in your README.md. Particularly, you may want additional interfaces that allow your glyphs to be customized as well as using other vector field visualization techniques discussed in class.