Assignment 02
HTML + SVG
Due: Feb. 03, 2020 03:29:59 PM
Graded: Feb. 10, 2020
Percentage of Grade: 5%
Assignment Description: Finalized
In this assignment you will create a simple webpage with some graphical content, using HTML, CSS, and SVG. Note that the MDN references for CSS and SVG may be helpful to refer to as you work on the following.
Please click here to create your repository
Objectives
This assignment is designed to teach you the basic building blocks of the web stack that we will manipulate in later projects using Javascript and d3 in order to create visualizations. Specific objectives include:
- Practicing and reviewing HTML syntax
- Experimenting with how to organize and apply CSS styles
- Using SVG element types and specifying their attributes
- Analyzing and debugging syntax errors through a developer console (e.g. Chrome’s or Firefox’s)
Creating Simple Charts Using SVG
The webpage you create should have five simple charts: two bar charts, two line charts and one pie chart (this is possibly the only time I’ll ask you to consider drawing a pie chart in earnest: we’ll see why in the Principles part of the course).
You should draw each chart in an SVG element of size \(400\times400\). The elements for each SVG chart need to have specific id attributes:
- bar chart with yellow bars:
yellow_bar_chart - bar chart with red bars:
red_bar_chart - line chart with line elements:
line_line_chart - line chart with path element:
path_line_chart - pie chart:
pie_chart
The name of the file should be index.html.
Bar Charts
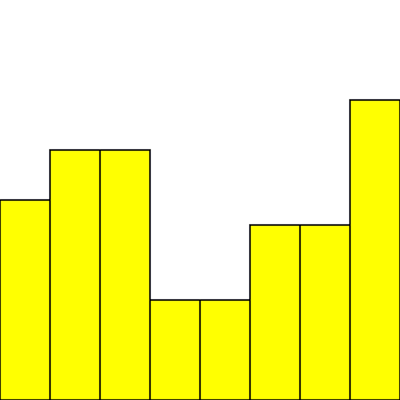
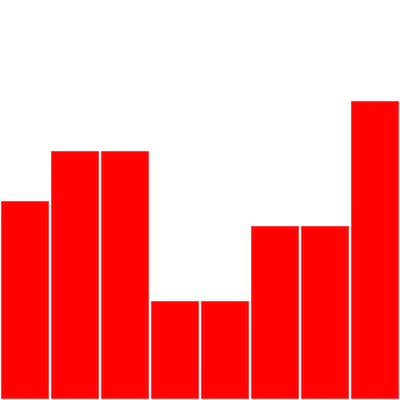
Your bar charts should take all horizontal space in the SVG (all 400 pixels). The individual bars should have the following height, in order: 200, 250, 250, 100, 100, 175, 175, 300.
You should create a bar chart with yellow bars in the SVG element named yellow_bar_chart, and a bar chart with red bars in the SVG element named red_bar_chart. In addition, the SVG elements inside each of the main elements should be IDENTICAL. In other words: any declarations that will influence the color of the bars need to be done with the attributes of the different outer SVG elements and your CSS declarations. It is important that you learn how to do this kind of thing because it will enable you, later on, to write better abstractions in d3. Better abstractions mean you can try more things faster. Trying more things, as we discussed, means you will end up with better visualizations.
Since each SVG chart has a unique id, the cleanest way to do is using a separate .css file where you place the associated style.
To simplify specifying the position and heights of bars, you may also want to consider using a group <g> for the bars and then an appropriate transform.
The two bar charts should look like the following, using appropriate fill and stroke styles to recreate the appearance:
Line Charts
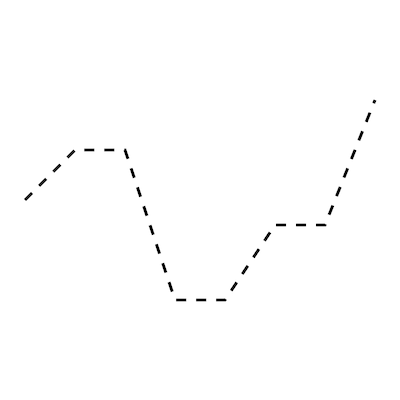
Your two line charts should look almost identical except for styling, but they will be constructed differently. The first line chart, line_line_chart, should be composed of SVG line elements. The second line chart, path_line_chart, should be composed of a single path element for the entire polyline. The heights of the vertices in the polyline should be the same as the heights of the individual bars for your bar charts.
Both of your line charts should look very similar to this:

Again, since each SVG chart has a unique id I expect all styling to apply only to the out SVG element and not to interior primitives. For specifying SVG paths, I highly recommend the MDN SVG Path tutorial as a great explanation of the syntax.
Pie Chart
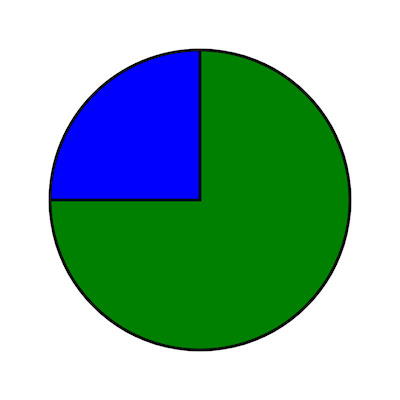
Your pie chart, pie_chart, should have two wedges. The first wedge should span an arc of 270 degrees with two line segments to connect to the center. This wedge should be green. The second wedge should span the remaining 90 degrees, and it should be blue.
Your pie chart should look very similar to this:
Unlike for line/bar charts, since each wedge is styled differently you can separately specify their style per SVG element as opposed to for the entire SVG outer canvas. As a result you may want to create separate id’s for each wedge in addition to the id for the chart.
Submission
You should use git to submit all source code files. The expectation is that your code will be graded by cloning your repo and then executing it within a modern browser (Chrome, Firefox, etc.)
Please provide a README.md file that provides a text description of how to run your program and any parameters that you used. Also document any idiosyncrasies, behaviors, or bugs of note that you want us to be aware of.
To summarize, my expectation is that your repo will contain:
- A
README.mdfile - A
index.htmlfile - (Optionally) a
.cssfile containing style information
Grading
Deductions
| Reason | Value |
| Bugs or syntax errors | -10 each bug at grader's discretion to fix |
Point Breakdown of Features
| Requirement | Value | ||||||
| External documentation (README.md) following the template provided in the base repository | 10 | ||||||
| Successfully validating as HTML5 according to the w3c validator | 10 | ||||||
Expected output / behavior for each of the five charts (16 points per chart) based on the assignment specification, including
| 16x5 = 80 | ||||||
| Total | 100 | ||||||
Cumulative Relationship to Final Grade
Worth 5% of your final grade